
SAG / ANSWER CENTER
How should I read the charts?
Compare the same questions, platforms and languages. Unchecked data is not 0%; changes to questions or conditions must be interpreted separately.
SEO exposure counts use a separate chart; AEO brand mentions and GEO official-source citations use percentage charts. Review original answers and evidence alongside the figures.
Compare identical questions, platforms and languages. Changed question sets belong to separate cohorts. Missing data is not zero, and every change cannot be attributed to your improvements. The graph below illustrates a layout, not actual customer results.
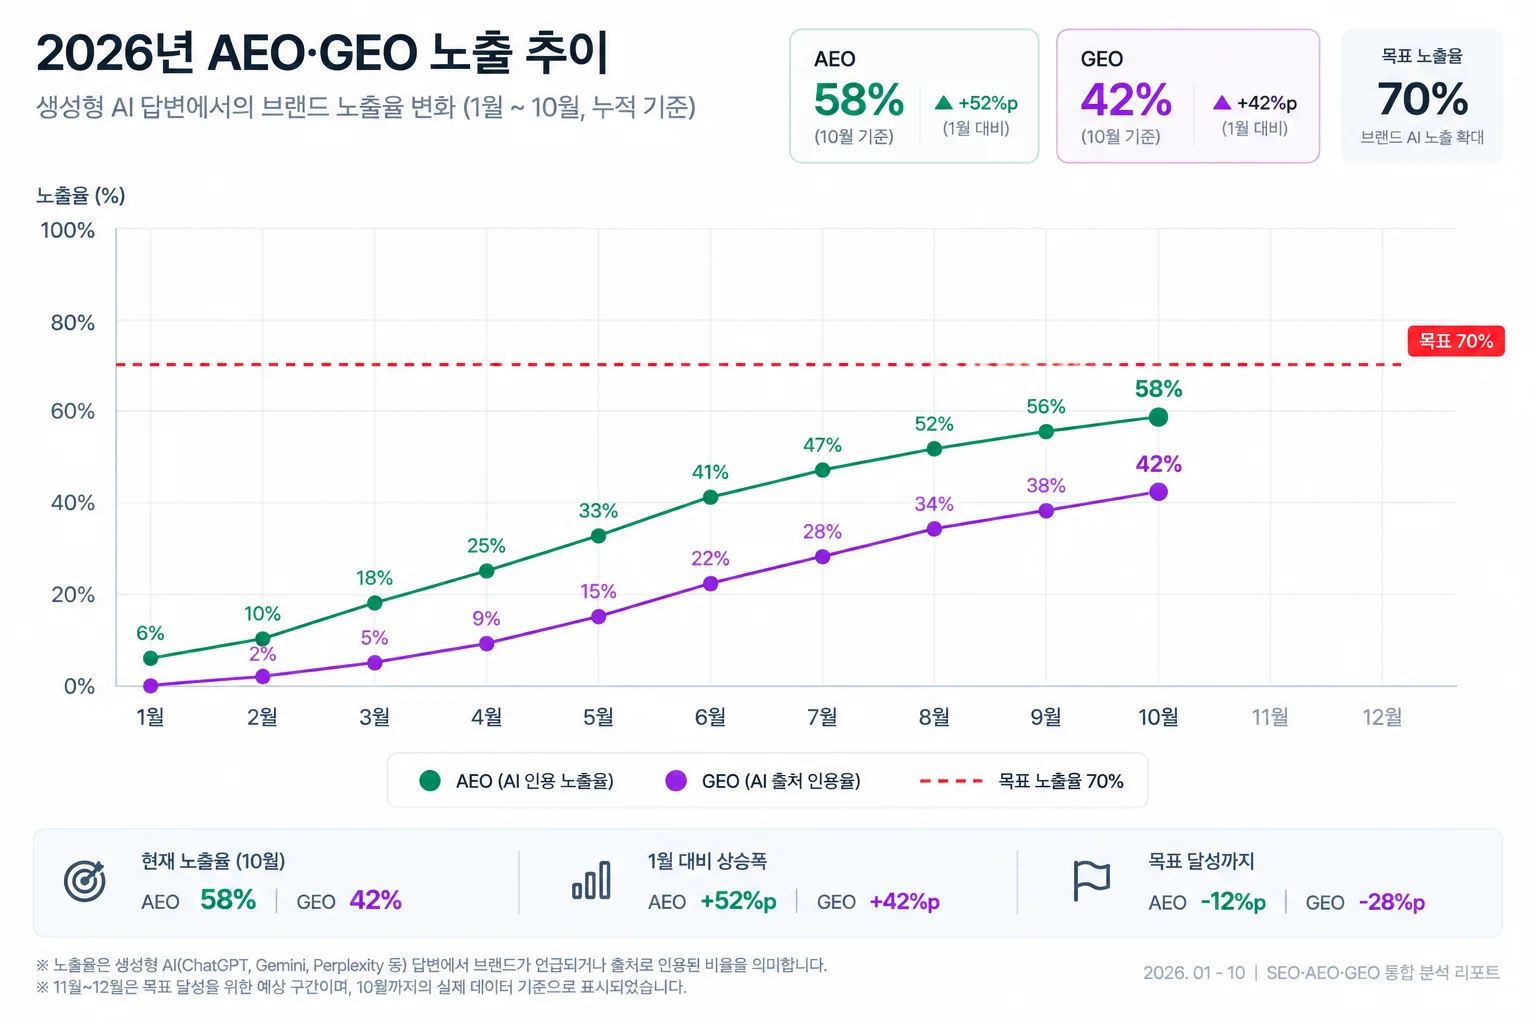
Illustrations and screens are examples; screens shown are in Korean. Figures and targets are illustrative, not customer results or guarantees.
Easy for customers to understand, easy for your team to act on
Customers get clear service descriptions and the answers they want; your team gets suggestions and priorities it can act on right away. After you apply the suggestions, we check together how search and AI mention your service and how site visits and inquiries change. These are expected benefits; actual changes are shown with results checked after you apply the suggestions.
SAG technical notes (Korean)
Related questions
- What is SAG?
- How do SEO, AEO and GEO differ?
- Can I preview SAG analysis before registering a website?
Official SAG service facts: How to verify cases and measurements
The Cream Union’s public projects demonstrate delivery experience. SAG outcomes require separately approved, actual observation evidence. Illustrative dashboards and charts are not customer results.
Check the public portfolio, but do not classify every advertising or UX/UI client as a SAG customer. A publishable SAG case should identify customer approval, question cohort, dates, product/API and model version, language/country, original answers, citations and the pages actually changed. Do not publish improvement figures without releasable evidence.
SEO reports official URL exposure counts with search engine, rank and scope. AEO = answers mentioning the brand / assessable answers × 100. GEO = answers citing an official source / assessable answers × 100. The denominators can differ. For calculation only, 5/20 is 25% and 2/20 is 10%; these are not customer results. Missing observations are not zero. Match conditions and avoid attributing every change to your work. Citations, visits, inquiries and revenue are distinct; interpret conversions only when actual data is connected.
Reviewed 15 October 2026. Availability and delivery scope depend on connected channels, plan and contract.